Can the spreader mess up our bacterial counts?
Disclaimer: This article is not a peer-reviewed scientific publication. It’s just a feedback report from a microbiology lab.
The goal is to get us thinking about our lab practices. Enjoy the read! 😉
Are there still bacteria on my hockey stick after spreading?
One common way to count bacteria on a Petri dish is by using a spreader to evenly spread the sample. It’s a simple and practical method, but it does come with a few limitations.
We already knew that a spreader can “kill” some microorganisms (by crushing or heating them), but could it also make us underestimate the results?
Recently on LinkedIn, we asked whether you thought bacteria remained on your spreaders after streaking… and an overwhelming majority said yes!
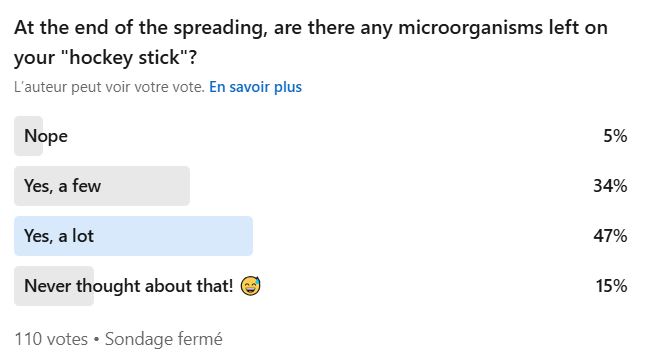
Your answer is clear: 81% said yes.
Now the question is: how many? A lot? A little? And most importantly, what’s the impact?
Because we’re scientists (well, of course!), we need evidence.
Luckily, one of you had already done some testing on the topic, and kindly agreed to share the results with us. Here there are !
Best Culture Media
Discover the 4 BEST Culture Media Suppliers
We survey the SuperMicrobiologists.
Here are their favorite EM culture media.
Field Study: Loss of Pseudomonas on Plastic Spreaders — Up to 22% Fewer Bacteria!
To assess the residual bioburden on the spreader, a simple approach was used:
- The first spread was performed with a spreader on the enumeration agar (“plate” in the table below).
- The second spread was done using the same spreader on a new agar plate (“spreader” in the table below).
The laboratory carried out two series of Pseudomonas aeruginosa spreads using media from two different suppliers.
Each spread was performed with a calibrated strain, delivering approximately 30–40 bacteria per inoculum (100 µL), using plastic spreaders.
Here are the results:
Agar Plate Supplier A
| Spreading 1 | Spreading 2 | |||||
| plate | spreader | % of loss | plate | spreader | % of loss | |
| Try 1 | 35 | 8 | 19% | 39 | 4 | 9% |
| Try 2 | 32 | 9 | 22% | 39 | 4 | 9% |
| Try 3 | 28 | 8 | 22% | 32 | 4 | 11% |
Agar Plate Supplier B
| Spreading 1 | Spreading 2 | Spreading 3 | |||||||
| plate | spreader | % of loss | plate | spreader | % of loss | plate | spreader | % of loss | |
| Try 1 | 42 | 2 | 5% | 40 | 3 | 7% | 40 | 4 | 9% |
| Try 2 | 46 | 2 | 4% | 44 | 4 | 8% | 46 | 5 | 10% |
| Try 3 | 43 | 2 | 4% | 41 | 4 | 9% | 42 | 5 | 11% |
The “loss” of P. aeruginosa ranges from 4% to 22%.
Is that really significant? Well… it depends.
It really comes down to the type of test and the method used.
- In a growth promotion test, for example, if you’re comparing two agar plates (old batch vs. new batch), you’d expect a similar “loss” on both, so the impact is probably minimal.
- But in a bioburden test, where the limit is 100 CFU/mL… that could definitely raise some concerns.
Taking it further
All of this really makes us want to dig deeper:
- Test other microorganisms (yeasts, molds, Gram-positive bacteria, spores…)
- Try different spreader materials (like glass, for example)
- Experiment with different concentrations
And if you have other data buried in your lab notebooks… we’d obviously love to see it!
A huge thank-you to Stéphane Guyonnot for sharing the results of this small but insightful study.


Leave a Reply
Want to join the discussion?Feel free to contribute!